The State Statistical Office has released the data on price developments for March 2026, which marks the first month following the outbreak of the military conflict between the United States/Israel and Iran.
According to these data, prices increased by 0.7% on a monthly basis and by 4.9% on an annual basis.
Given the heightened expectations of accelerating price growth driven by the sharp increase in global crude oil prices, this brief examines whether this oil shock has evolved into a broader price shock, that is, whether it has spilled over into the general price level.
Signs indicating a spillover of the oil shock to other prices
On a monthly basis, prices showed some stabilization, declining by 0.7% in January 2026 compared to December 2025, followed by a modest increase of 0.2% in February 2026 relative to the previous month. In this context, the 0.7% increase in prices in March compared to February 2026 may signal a mild acceleration of inflation, particularly given that—had the military conflict in Iran not occurred—expectations were for inflation to continue on a path of further moderation. However, such monthly dynamics are not dramatically higher than those observed during 2025 (Chart 1).
Chart 1 – Monthly inflation dynamics
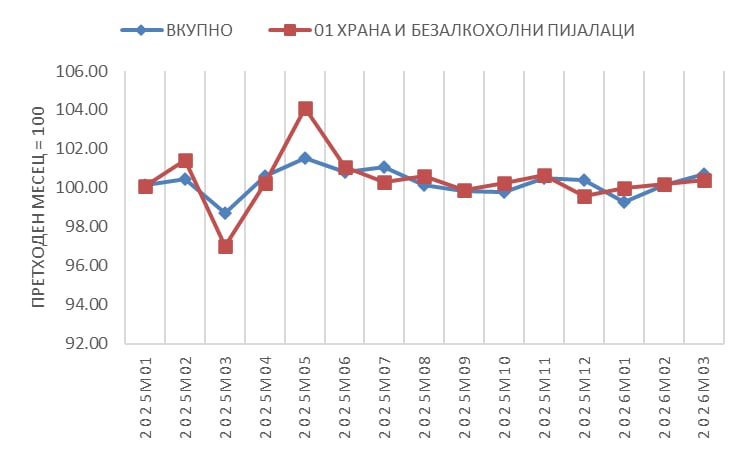
Source: SSO.
However, from this general picture, two groups stand out (Chart 2):
i) Transport (3.4%), within which the price of fuels and lubricants for personal transport equipment increased by 11.4% in March compared to February 2026; and
ii) Alcoholic beverages, tobacco, and narcotics (3.2%), entirely driven by the increase in tobacco prices (4.3%).
While the price increase in the first group is fully a reflection of the military conflict in Iran, the second group is unrelated to it. The direct effect of higher crude oil prices is most clearly observed through the sharp increase in liquid fuels (18.7%), although its overall weight is relatively small, as the broader category of Housing, water, electricity, gas, and other fuels recorded only a modest price increase of 0.2%.
Chart 2 – Monthly dynamics of selected inflation components
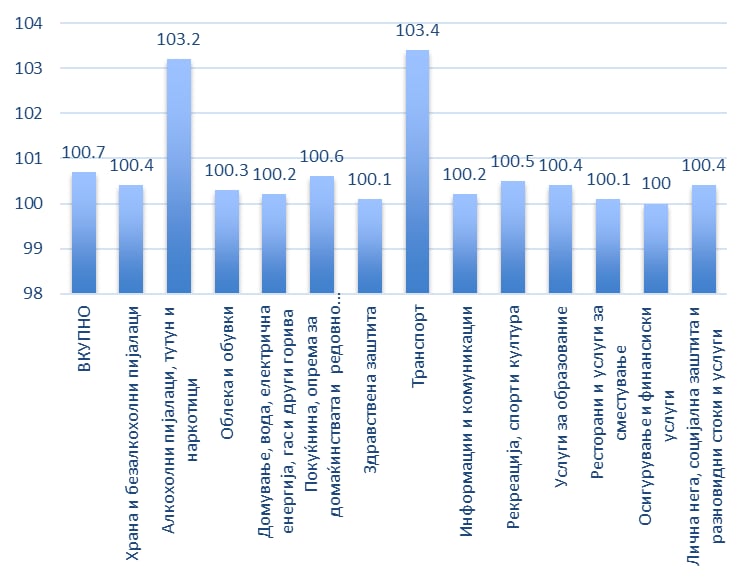
Source: SSO.
Similarly, within the food category, a notable monthly increase is observed in oils (2.2%), likely driven primarily by reduced global supply of palm oil (due to adverse weather conditions) and sunflower oil (due to the war in Ukraine), as well as higher transport costs resulting from rising oil prices.
Based on the monthly inflation dynamics, there is a modest—one could say limited but not negligible—pass-through effect from global oil prices to the overall price level. This is in line with our earlier estimates presented in Policy Brief No. 78: How much will the global oil shock pass through to the domestic economy? (10 March 2026), which suggest that a 10% increase in oil prices leads to an additional increase in the overall price level of about 0.1 to 0.2 percentage points in the short run, i.e., within the first 1–3 months following the shock.
This effect reflects both the direct impact of petroleum products in the consumption basket and the indirect impact through transport costs and certain limited product groups.
Signs that may be misinterpreted as spillovers of the oil shock
At first glance, the annual inflation rate of 4.9% in March 2026 appears concerning, as it represents an acceleration compared to March 2025 and deviates from expectations of a gradual decline toward around 3%.
However, there is a risk that these data may be misinterpreted as evidence of a broader spillover of the oil shock into the general price level, which is not supported by the underlying dynamics. A comparison with March 2025 reveals a significantly low base, resulting from the Easter–Ramadan administrative measures that froze margins and prices of food, beverages, and household chemical products, which were in effect from 20 February to the end of April 2025 (see Chart 3).
Chart 3 – Annual inflation dynamics
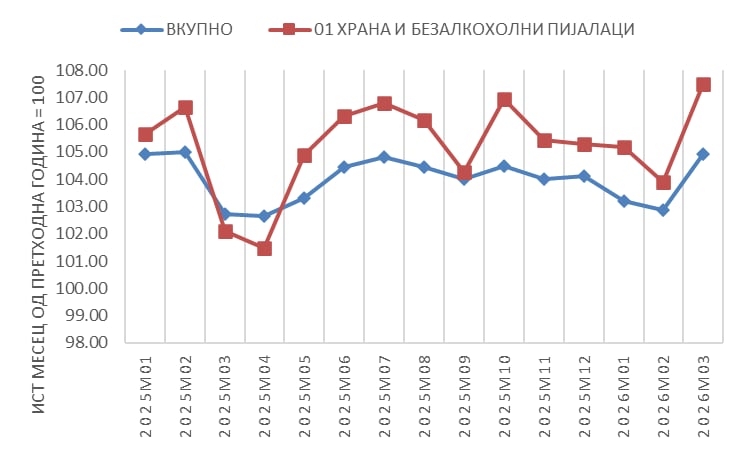
Source: SSO.
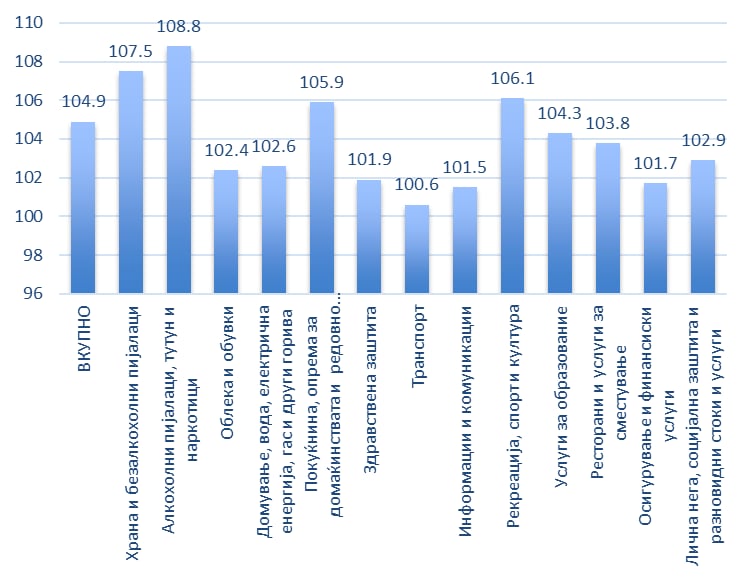
Source: SSO.
Although the oil shock is already clearly visible in fuel prices and transport costs, there is, for now, no evidence that it has spilled over into broader, systemic inflation. If the annual rate of 4.9% is interpreted as an alarm signal, it would be misleading, as it largely reflects a low base effect created by the administrative price freeze in the same period last year. Nevertheless, the current monthly increase is not negligible and, if sustained, could quickly evolve into broader inflationary pressures through second-round effects—initially in food products and subsequently across the wider consumption basket.
In conclusion, the current increase in prices primarily reflects the economy’s direct exposure to the oil shock, without clear signs of widespread spillovers. However, this stability is fragile: if energy prices remain elevated and continue to rise, the risk of a broader inflationary wave—through transport costs and inflation expectations—will increase significantly. Therefore, the current data do not justify panic, but neither do they allow for complacency. Close monitoring of monthly dynamics will be crucial in the coming months. In this context, strictly targeted measures to mitigate the impact on the most affected households and firms should be prepared and ready for rapid and effective deployment should the price shock intensify.
According to our earlier estimates (see FT Opinion No. 68 on the inflationary effects of the energy shock, 26 March 2026), if the conflict persists and/or escalates, broader-based effects could begin to materialize as early as April, with more pronounced intensity from June onward.